

Project
RAND Survey Panels
Feb 28, 2024
ResearchPublished Jan 29, 2026
RAND administers several survey panels that are dedicated to collecting and disseminating state-of-the-art survey data. For each survey panel, RAND uses high-quality recruitment and statistical methods and reaches a nationally representative sample of key populations. Panel members complete surveys on issues that are critical to policymakers, public officials, and researchers. The following figures are derived from RAND Survey Panels data. This page is updated periodically with new data.
Published Oct 26, 2026

Published Oct 12, 2026

Published Sep 30, 2026

Published Sep 14, 2026

Published Aug 13, 2026
Percentage of teachers and similar working adults reporting varying levels of financial well-being
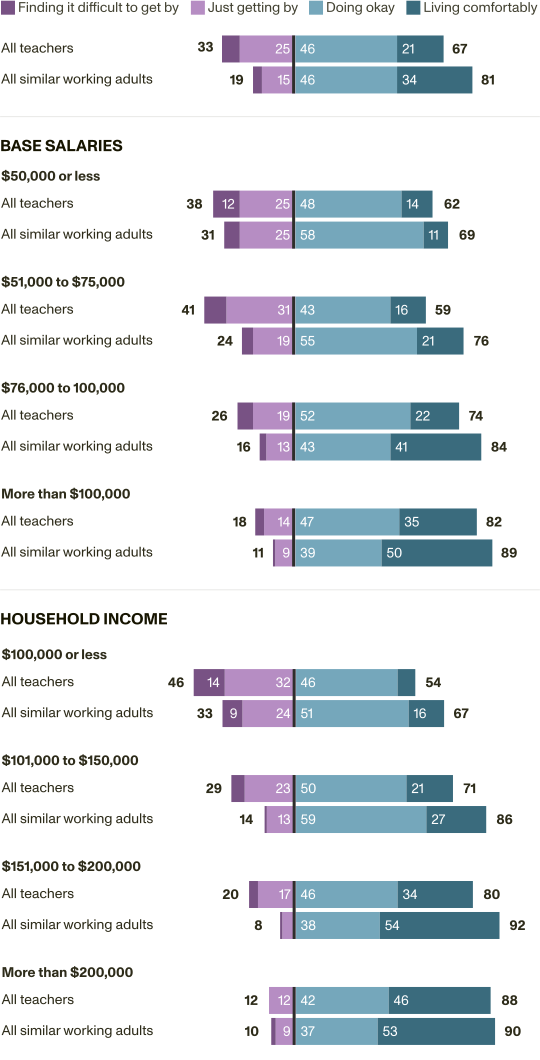
NOTE: This figure depicts response data from the following survey question administered to a nationally representative sample of teachers via RAND’s American Teacher Panel between January 28, 2026, and February 21, 2026, and a nationally representative sample of similar working adults via RAND’s American Life Panel between February 5, 2026, and February 25, 2026: “Overall, which one of the following best describes how well you are managing financially these days?” (n teachers= 819; n similar working adults = 498). The response options were as follows: “Living comfortably,” “Doing okay,” “Just getting by,” and “Finding it difficult to get by.” Similar working adults is defined as employed adults ages 18 to 65 who were not part of the teacher workforce and whose highest level of education was a bachelor’s degree or higher. Differences between the sums noted in the figure and the sums of the numbers listed are because of rounding. This work was funded by the American Federation of Teachers and the National Education Association.
Overall
| Group | Finding it difficult to get by | Just getting by | Doing okay | Living comfortably |
|---|---|---|---|---|
| All teachers | 8% | 25% | 46% | 21% |
| All similar working adults | 4% | 15% | 46% | 34% |
Base salaries: $50,000 or less
| Group | Finding it difficult to get by | Just getting by | Doing okay | Living comfortably |
|---|---|---|---|---|
| All teachers | 12% | 25% | 48% | 14% |
| All similar working adults | 7% | 25% | 58% | 11% |
Base salaries: $51,000 to $75,000
| Group | Finding it difficult to get by | Just getting by | Doing okay | Living comfortably |
|---|---|---|---|---|
| All teachers | 10% | 31% | 43% | 16% |
| All similar working adults | 5% | 19% | 55% | 21% |
Base salaries: $76,000 to $100,000
| Group | Finding it difficult to get by | Just getting by | Doing okay | Living comfortably |
|---|---|---|---|---|
| All teachers | 7% | 19% | 52% | 22% |
| All similar working adults | 3% | 13% | 43% | 41% |
Base salaries: More than $100,000
| Group | Finding it difficult to get by | Just getting by | Doing okay | Living comfortably |
|---|---|---|---|---|
| All teachers | 4% | 14% | 47% | 35% |
| All similar working adults | 1% | 9% | 39% | 50% |
Household income: $100,000 or less
| Group | Finding it difficult to get by | Just getting by | Doing okay | Living comfortably |
|---|---|---|---|---|
| All teachers | 14% | 32% | 46% | 8% |
| All similar working adults | 9% | 24% | 51% | 16% |
Household income: $101,000 to $150,000
| Group | Finding it difficult to get by | Just getting by | Doing okay | Living comfortably |
|---|---|---|---|---|
| All teachers | 6% | 23% | 50% | 21% |
| All similar working adults | 1% | 13% | 59% | 27% |
Household income: $151,000 to $200,000
| Group | Finding it difficult to get by | Just getting by | Doing okay | Living comfortably |
|---|---|---|---|---|
| All teachers | 4% | 17% | 46% | 34% |
| All similar working adults | 1% | 6% | 38% | 54% |
Household income: More than $200,000
| Group | Finding it difficult to get by | Just getting by | Doing okay | Living comfortably |
|---|---|---|---|---|
| All teachers | 0% | 12% | 42% | 46% |
| All similar working adults | 2% | 9% | 37% | 53% |
Published Jul 28, 2026

Published Jul 14, 2026

Published May 13, 2026
Published Apr 23, 2026

Published Mar 23, 2026

Published Mar 06, 2026

Published Mar 06, 2026

Published Feb 26, 2026

Published Feb 24, 2026
Percentage of students (ages 12 to 29) and superintendents who agreed or strongly agreed that using AI for schoolwork will harm students' critical thinking skills


NOTE: Panel A depicts response data from the following survey question administered to nationally representative samples of school district representatives in October 2024 and October 2025: “How much do you agree or disagree with the following statement? The more students use generative artificial intelligence systems such as ChatGPT for their schoolwork, the more it will impede the development of their critical thinking skills.” Panels B–E depict response data from the following survey question administered to nationally representative samples of students in February 2025 and December 2025: “How much do you agree or disagree with the following statement? The more students use AI (such as ChatGPT) for their schoolwork, the more it will harm their critical thinking skills.” There are differences in the composition of survey respondents between the two dates for these panels. In particular, the December 2025 survey sampled more older students who were more likely to be in postsecondary education. Data in Panel E should be interpreted with caution; the February 2025 sample size is particularly small. In each panel, the percentage who strongly agree and the percentage who agree may not add up to the combined total because of rounding. AI = artificial intelligence.
Read the ReportPublished Feb 20, 2026

Published Jan 29, 2026

This work was conducted by the Education and Employment Program of RAND Education, Employment, and Infrastructure.
This publication is part of the RAND research report series. Research reports present research findings and objective analysis that address the challenges facing the public and private sectors. All RAND research reports undergo rigorous peer review to ensure high standards for research quality and objectivity.
This document and trademark(s) contained herein are protected by law. This representation of RAND intellectual property is provided for noncommercial use only. Unauthorized posting of this publication online is prohibited; linking directly to this product page is encouraged. Permission is required from RAND to reproduce, or reuse in another form, any of its research documents for commercial purposes. For information on reprint and reuse permissions, please visit www.rand.org/pubs/permissions.
RAND is a nonprofit institution that helps improve policy and decisionmaking through research and analysis. RAND's publications do not necessarily reflect the opinions of its research clients and sponsors.